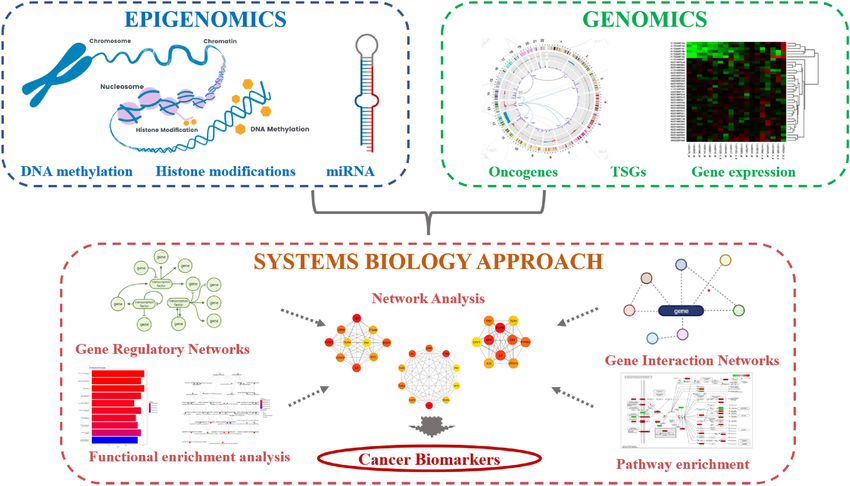
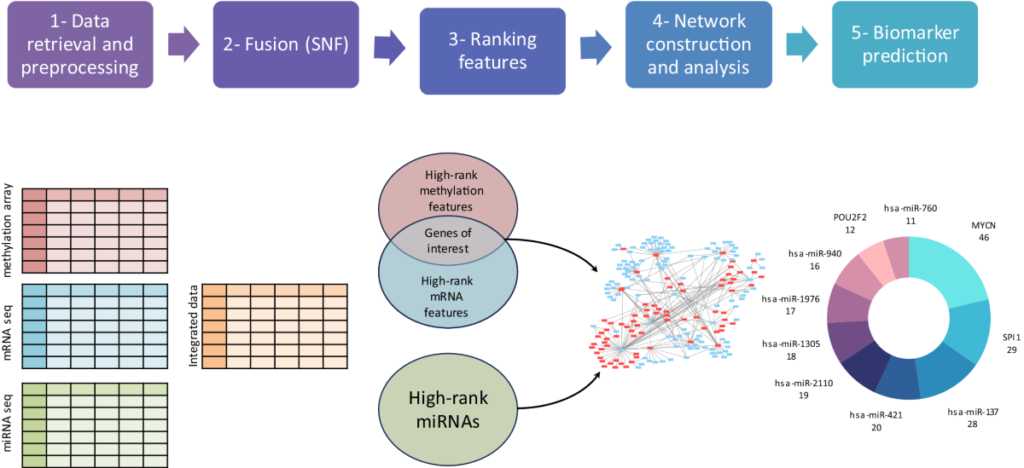
Biomarker discovery is a critical aspect of modern biomedical research, enabling early disease detection, prognosis, and the development of targeted therapies. With the explosion of high-throughput gene expression data from techniques like microarrays and RNA sequencing, researchers now have the ability to analyze the expression of thousands of genes across different conditions. One of the most powerful tools for analyzing such large datasets is clustering analysis. This method groups genes or samples with similar expression patterns, thereby uncovering potential biomarkers that are indicative of specific biological states or diseases. In this article, we will explore how clustering enhances biomarker discovery in gene expression studies.

The Role of Biomarkers in Biomedical Research
Before delving into the specifics of clustering, it’s important to understand the significance of biomarkers in medical and biological research. Biomarkers are measurable indicators of biological processes, diseases, or responses to treatment. They can be genetic, molecular, or even physiological traits. In gene expression studies, biomarkers typically refer to genes whose expression levels are associated with a specific disease state, treatment outcome, or biological condition.
Biomarkers play several essential roles in healthcare:
- Disease Diagnosis: Biomarkers can indicate the presence of a disease, often before clinical symptoms arise.
- Prognosis: Certain biomarkers can predict disease progression, helping doctors make informed treatment decisions.
- Personalized Medicine: Biomarkers enable the development of targeted therapies tailored to individual genetic profiles.
- Treatment Response Monitoring: Biomarkers help track how well a patient is responding to a given treatment, allowing for adjustments if necessary.
Introduction to Clustering Analysis in Gene Expression Studies
In the context of gene expression data, clustering analysis is used to group genes or samples that exhibit similar expression profiles. The underlying assumption is that genes with similar expression patterns are likely involved in related biological processes or regulatory networks. Similarly, samples (e.g., from different patients) that cluster together may share common molecular traits or disease subtypes.
Clustering analysis has two main applications in gene expression studies:
- Gene Clustering: Groups genes with similar expression profiles across different conditions or time points. This can identify genes that are co-expressed and potentially co-regulated.
- Sample Clustering: Organizes samples (e.g., patient tissue samples) based on their expression profiles, helping to uncover distinct molecular subtypes of diseases like cancer.

How Clustering Enhances Biomarker Discovery
Clustering analysis plays a pivotal role in identifying biomarkers by revealing patterns that may not be apparent through traditional methods. Here’s how clustering enhances biomarker discovery in gene expression studies:
1. Identifying Co-expressed Genes as Biomarkers
Gene clustering allows researchers to identify groups of co-expressed genes that are likely involved in the same biological pathways. Often, several genes work together to drive a disease process or a treatment response. By clustering these genes, researchers can pinpoint a subset of genes whose expression patterns are associated with a specific disease state.
For example, in cancer research, clustering analysis can help identify genes whose expression is elevated in tumor samples compared to healthy tissue. These co-expressed genes may serve as potential biomarkers for diagnosing cancer or predicting its progression.
In the context of biomarker discovery, clustering analysis can help:
- Highlight key regulators: Genes at the center of co-expressed clusters often play regulatory roles in biological pathways, making them prime candidates for biomarkers.
- Reduce data complexity: Clustering simplifies the vast amount of gene expression data by organizing genes into meaningful groups, making it easier to identify relevant biomarkers.
2. Discovering Disease Subtypes through Sample Clustering
In addition to clustering genes, sample clustering is a powerful method for identifying disease subtypes, especially in heterogeneous conditions like cancer. By clustering patient samples based on their gene expression profiles, researchers can identify groups of patients with similar molecular characteristics.
This has important implications for biomarker discovery:
- Subtype-specific biomarkers: Different subtypes of the same disease may exhibit unique molecular signatures. Clustering patient samples enables the discovery of biomarkers that are specific to each subtype, improving diagnostic accuracy and treatment outcomes.
- Personalized medicine: Sample clustering helps in stratifying patients, allowing for the development of personalized treatment plans based on the molecular subtype of the disease.
For instance, in breast cancer research, sample clustering has led to the identification of molecular subtypes such as luminal A, luminal B, HER2-enriched, and basal-like, each with distinct gene expression profiles. Biomarkers identified through clustering can guide personalized treatment strategies for patients in these subtypes.
3. Uncovering Novel Biomarker Candidates
Clustering analysis often reveals previously unknown relationships between genes or samples, providing a starting point for the discovery of novel biomarkers. Unlike supervised methods that rely on pre-defined categories, clustering is an unsupervised learning technique, meaning it doesn’t require prior knowledge about the data. This allows clustering analysis to uncover unexpected patterns in gene expression data.
By grouping genes or samples based solely on their expression patterns, clustering analysis can highlight biomarkers that may not have been identified through hypothesis-driven approaches.
For example, clustering analysis might reveal a group of genes that are consistently overexpressed in a subset of cancer patients. Upon further investigation, one of these genes could emerge as a novel biomarker for predicting patient response to a specific treatment.
4. Facilitating Feature Selection in Biomarker Discovery
One of the challenges of biomarker discovery in gene expression studies is the high dimensionality of the data. A typical gene expression dataset might contain thousands of genes, but only a small subset of them are relevant as potential biomarkers. Clustering analysis helps in feature selection by reducing the number of genes under consideration.
By clustering genes based on their expression patterns, researchers can focus on representative genes from each cluster that best capture the expression dynamics of the group. This reduces the complexity of the data and increases the likelihood of identifying robust biomarkers.
For example, in a study looking for biomarkers to predict chemotherapy response, clustering analysis could group thousands of genes into a few distinct clusters. Researchers can then prioritize specific clusters and representative genes within those clusters for further validation as biomarkers.
5. Visualizing Biomarker Patterns with Heatmaps and Dendrograms
Visualization is a crucial aspect of how clustering enhances biomarker discovery. Clustering analysis produces intuitive visual representations such as heatmaps and dendrograms, which make it easier to interpret complex gene expression data.
- Heatmaps: A heatmap is a color-coded matrix that shows the expression levels of genes across samples, with genes and samples grouped by clusters. This provides a clear visual representation of which genes are upregulated or downregulated in specific clusters, helping to pinpoint biomarkers.
- Dendrograms: Dendrograms, often generated from hierarchical clustering, display the relationships between clusters. This tree-like structure helps researchers visualize how closely related different genes or samples are, facilitating the identification of biomarker candidates.
By clustering genes and samples, heatmaps and dendrograms offer a high-level overview of potential biomarkers, guiding further experimental validation.

Clustering Methods Commonly Used in Biomarker Discovery
Several algorithms are commonly used in gene expression studies to see how clustering enhances biomarker discovery. The choice of method depends on the characteristics of the data and the research question:
- K-means Clustering: This method partitions genes or samples into a predefined number of clusters. It is useful for large datasets and when researchers have a rough idea of how many clusters they expect.
- Hierarchical Clustering: Builds a dendrogram representing the nested relationships between clusters. Hierarchical clustering is especially useful for visualizing complex relationships in gene expression data.
- DBSCAN: A density-based clustering method that identifies clusters of varying shapes and sizes, making it ideal for data with irregular structures.
Conclusion
A powerful tool that significantly Shows how clustering enhances biomarker discovery in gene expression studies. By organizing genes and samples based on their expression patterns, clustering helps identify co-expressed genes, discover disease subtypes, and uncover novel biomarkers. Its ability to simplify complex data, coupled with intuitive visualization techniques, makes clustering indispensable for advancing biomarker research.
As gene expression technologies continue to evolve, the application of how clustering enhances biomarker discovery will remain crucial in the discovery of biomarkers, ultimately paving the way for more accurate diagnostics, personalized treatments, and improved patient outcomes.
If you want to explore more about applications of how Clustering Enhances Biomarker Discovery you can join us in Bengaluru for an exciting 1 Day Training. More information is available HERE
