In the vast landscape of genomics, analyzing gene expression data has become pivotal for uncovering intricate biological patterns. One powerful technique in this arena is clustering gene expression analysis. This approach enables researchers to group genes with similar expression profiles, leading to valuable insights into gene function, regulatory mechanisms, and biological pathways. In this article, we will explore the concept of clustering gene expression data, focusing on its steps, methods, and applications, with special emphasis on the role of clustering analysis.
What is Clustering Gene Expression Analysis?
Clustering gene expression analysis is a technique used to organize data points, in this case, genes, into clusters or groups based on their similarities. In gene expression studies, this can be achieved by analyzing the expression levels of genes across different samples or conditions. The goal is to group genes that exhibit similar expression patterns under specific conditions, assuming that genes with similar expression profiles may share functional relationships.
Clustering gene expression analysis is particularly useful when dealing with large-scale data, such as those generated from microarray experiments or RNA sequencing. By clustering genes, researchers can reduce the complexity of their data and focus on specific biological patterns that may be otherwise difficult to identify.
Why Clustering is Important in Gene Expression Analysis
The massive amount of data generated in gene expression studies demands robust techniques to extract meaningful insights. Clustering analysis provides several advantages:
- Identification of Co-expressed Genes: Clustering can reveal sets of genes that are co-regulated, potentially indicating shared functional roles.
- Gene Function Prediction: Uncharacterized genes can be clustered with known genes, offering clues about their potential biological functions.
- Insight into Biological Pathways: Clustering gene expression data helps identify which genes participate in similar biological pathways or processes.
- Disease Mechanism Discovery: In medical research, clustering can identify genes with expression patterns linked to specific diseases, providing valuable insights for diagnostics and treatment.
Steps to Perform Clustering Analysis on Gene Expression Data
Clustering gene expression data is a multi-step process. Each step requires careful consideration of the data characteristics and the biological questions you aim to answer. Here’s a step-by-step guide to performing clustering analysis on gene expression data:
1. Data Collection and Preprocessing
Before diving into clustering, it’s essential to collect clean and well-organized gene expression data. This data is often obtained from high-throughput technologies like RNA-seq or microarray platforms. Depending on the source, the data may contain raw counts or normalized expression levels.
- Normalization: Raw data needs to be normalized to correct for technical biases. Techniques like TMM (Trimmed Mean of M-values), FPKM (Fragments Per Kilobase of transcript per Million mapped reads), or log-transformation are commonly used.
- Filtering: Genes with low or insignificant expression levels across samples are typically removed to avoid noise in clustering.
- Missing Values: Handle missing data points by either imputing them or removing the affected genes.
2. Choosing a Distance Measure
Once the data is prepared, the next step is to select an appropriate distance metric. The distance between two gene expression profiles indicates how similar they are.
Common distance measures include:
- Euclidean Distance: A simple measure based on the geometric distance between two points in multidimensional space.
- Pearson Correlation: Measures the linear relationship between two expression profiles, often preferred for gene expression clustering due to its ability to capture similarity in expression trends.
- Spearman Correlation: A rank-based correlation metric, which is robust to outliers and does not assume a linear relationship between variables.
3. Choosing a Clustering Algorithm
The choice of clustering algorithm plays a crucial role in the outcome of the analysis. Various methods have been developed, each with its strengths and limitations. The most commonly used clustering algorithms in gene expression analysis include:
- K-means Clustering: A popular method that partitions the data into a predefined number of clusters (K). Each gene is assigned to the cluster with the nearest centroid, and the centroids are recalculated iteratively until convergence.Advantages: Simple and efficient for large datasets.Limitations: The user must define the number of clusters (K) in advance, which may not always be intuitive.
- Hierarchical Clustering: Builds a tree-like structure (dendrogram) by either successively merging smaller clusters (agglomerative approach) or splitting larger clusters (divisive approach). Hierarchical clustering provides a visual representation of how genes are related.Advantages: No need to specify the number of clusters in advance; useful for visualizing data.Limitations: Computationally expensive for very large datasets.
- DBSCAN (Density-Based Spatial Clustering of Applications with Noise): A density-based method that identifies clusters based on the density of data points in a region, allowing for the identification of noise or outliers.Advantages: Can discover clusters of arbitrary shape; robust to noise.Limitations: May struggle with varying cluster densities.
4. Determining the Optimal Number of Clusters
Choosing the right number of clusters is a critical step in clustering analysis. If you choose too few clusters, you may overlook important patterns; too many clusters can lead to overfitting and obscure meaningful insights.
Several methods can help determine the optimal number of clusters:
- Elbow Method: This technique plots the within-cluster sum of squares (inertia) against the number of clusters. The “elbow” in the plot suggests the optimal number of clusters.
- Silhouette Score: Measures how similar an object is to its cluster compared to other clusters. A high silhouette score indicates that the object is well matched to its cluster and poorly matched to neighboring clusters.
- Gap Statistic: Compares the total intra-cluster variation for different numbers of clusters to a null reference distribution.
5. Visualizing the Clusters
Once the clusters are formed, visualizing the results is key to interpreting them. Common visualization techniques include:
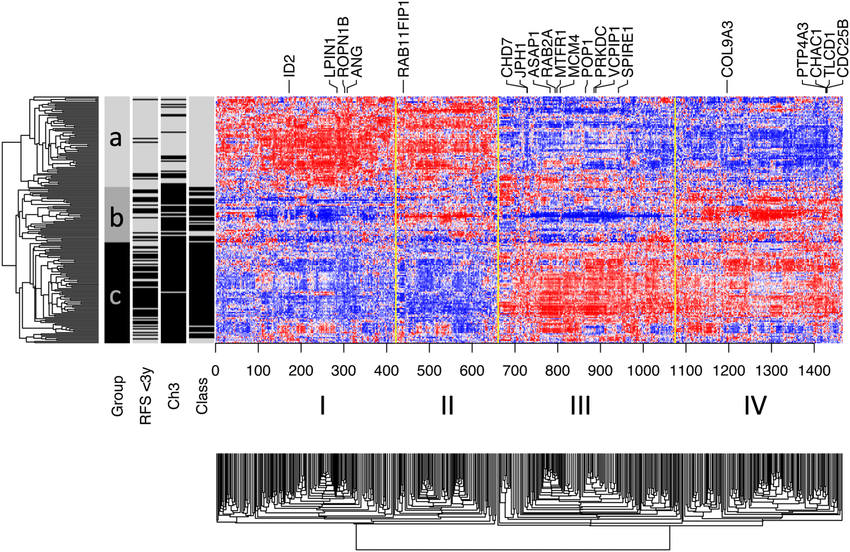
- Heatmaps: A color-coded matrix representing the expression levels of genes across samples, with genes grouped by cluster.
- Principal Component Analysis (PCA): A dimensionality reduction technique used to project high-dimensional data into a lower-dimensional space, facilitating the visualization of cluster separation.
- t-SNE (t-Distributed Stochastic Neighbor Embedding): Another dimensionality reduction method that is particularly useful for visualizing high-dimensional data, often outperforming PCA in preserving local structure.
6. Biological Interpretation and Validation
After clustering analysis, it’s essential to validate the results and interpret them in a biological context. This involves:
- Gene Ontology (GO) Enrichment Analysis: Determines whether certain biological processes, cellular components, or molecular functions are overrepresented in a cluster.
- Pathway Analysis: Identifies which biological pathways are associated with the genes in each cluster, providing insights into the functional roles of gene groups.
- Experimental Validation: Further experiments, such as knockdown or overexpression studies, can confirm whether the genes in the cluster behave as predicted by the analysis.
Applications of Clustering Analysis in Gene Expression Studies
Clustering gene expression analysis has become a cornerstone in various biological and medical research areas:
- Cancer Research: Identifying cancer subtypes based on gene expression profiles, allowing for personalized treatment approaches.
- Drug Discovery: Clustering can help find target genes that respond similarly to drug treatments, streamlining drug development.
- Evolutionary Studies: Comparing gene expression patterns across species to understand evolutionary relationships.
Conclusion
Clustering gene expression analysis is a powerful tool for unraveling the complexities hidden within gene expression data. By grouping genes with similar expression patterns, researchers can gain insights into gene function, regulatory networks, and disease mechanisms. As genomic technologies continue to evolve, clustering will remain an essential method for interpreting the vast datasets generated in gene expression studies.
By following this step-by-step guide, you can effectively apply clustering analysis to your gene expression data and unlock valuable biological insights.
If you want to explore more about applications of Clustering gene expression Analysis using Gene Expression Dataset you can join us in Bengaluru for an exciting 1 Day Training. More information is available HERE